PaxCast

Bus network planning · Built by Infin8 Digital

See where the network falls short.
Then fix it.

PaxCast puts every bus service, stop and census area on one map. It shows who is left without a bus, finds the corridors worth serving, and lets you draw a route and see who it reaches, the buses it needs and what it costs, while you draw.

Access is by invitation. Ask contact@infin8.digital for a walkthrough on your network.

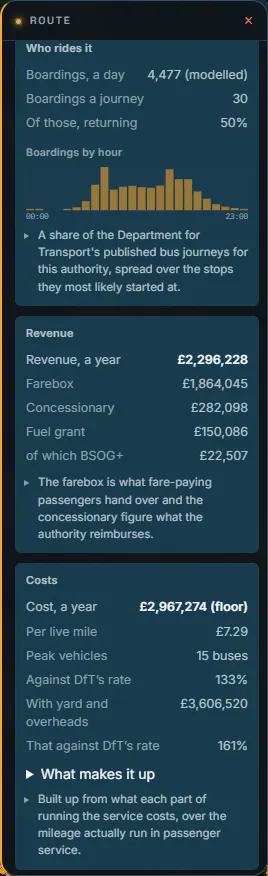
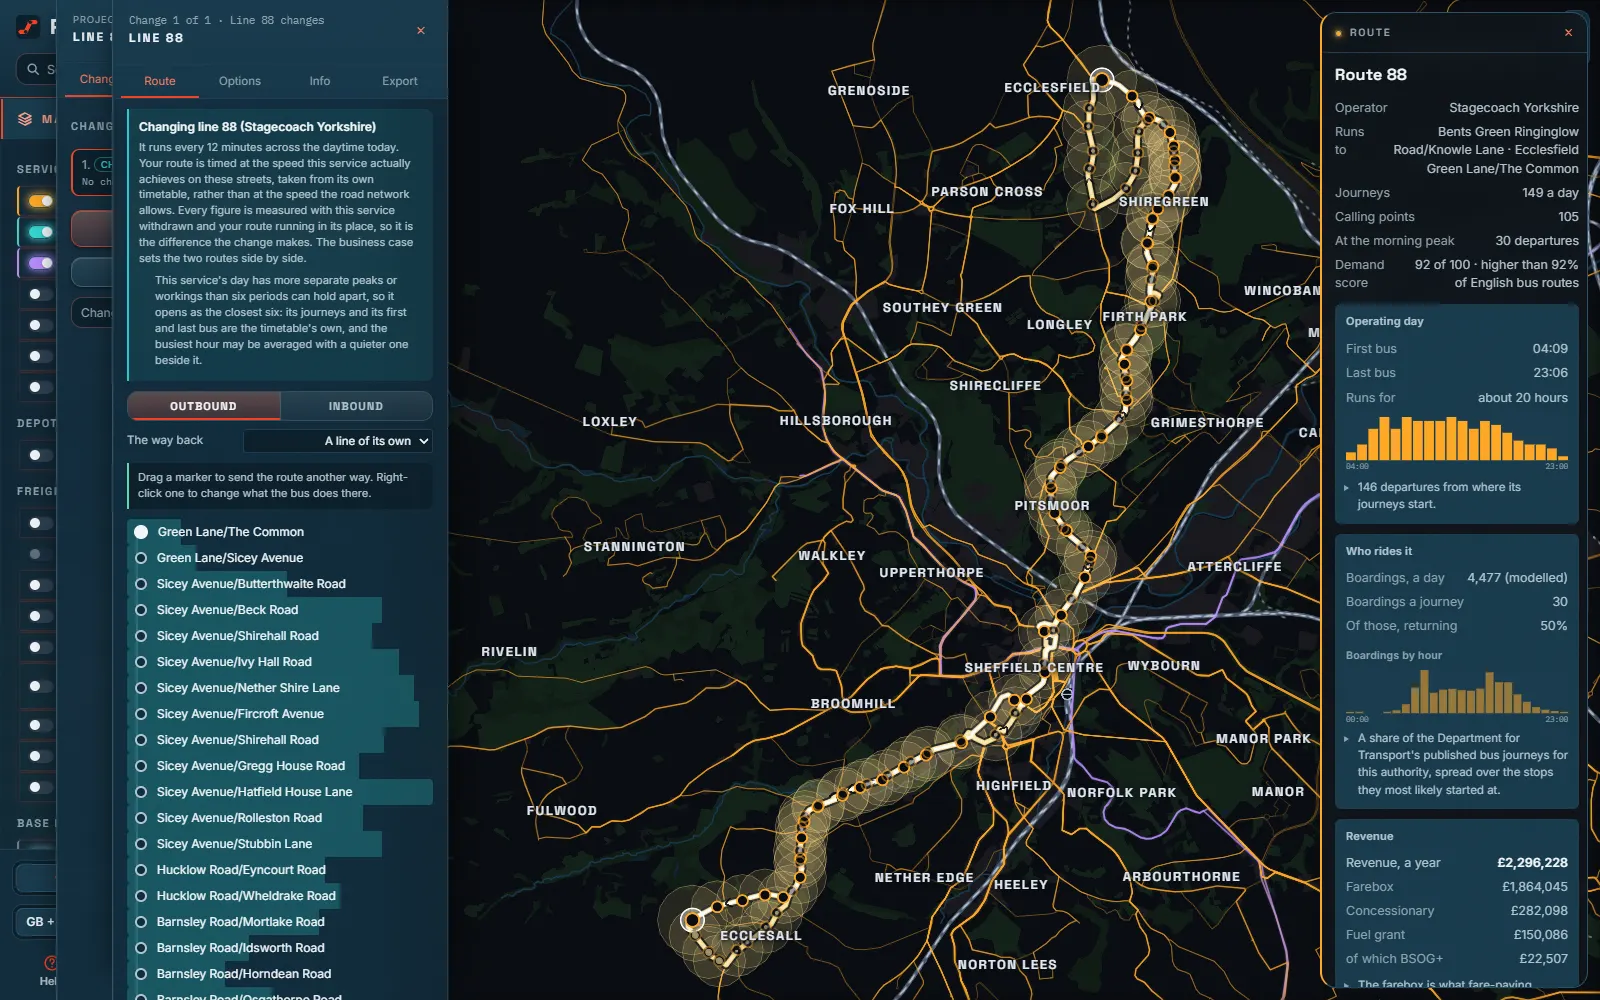
PaxCast's Editor open on Stagecoach Yorkshire's route 88 in Sheffield: its calling points on the left, its line of route and catchment on the map, and its operating day, boardings and revenue on the right.
Stagecoach Yorkshire's 88 in Sheffield, opened in the Editor beside what it carries and earns.

300,000+

bus stops on one map

12,000+

bus services, timetabled to the minute

90+

open datasets, loaded as they are published

33

kinds of report, as PDF or slides

01  What it does

From the gap on the map to the case for fixing it.

Six things a planner does every week, each a few clicks, each on the same published data and the same models.

Find the shortfall

Where the network falls short, and for whom.

Every census area is scored on who needs a bus: households without a car, older residents, deprivation, density. Lay that beside the walk to a stop with a service and the gaps stand out, sized by the people in them.

  • Need and access, evening and Sunday as well as the weekday
  • What each area can reach: GPs, schools, jobs, hospitals
  • The services that are the only bus somebody has
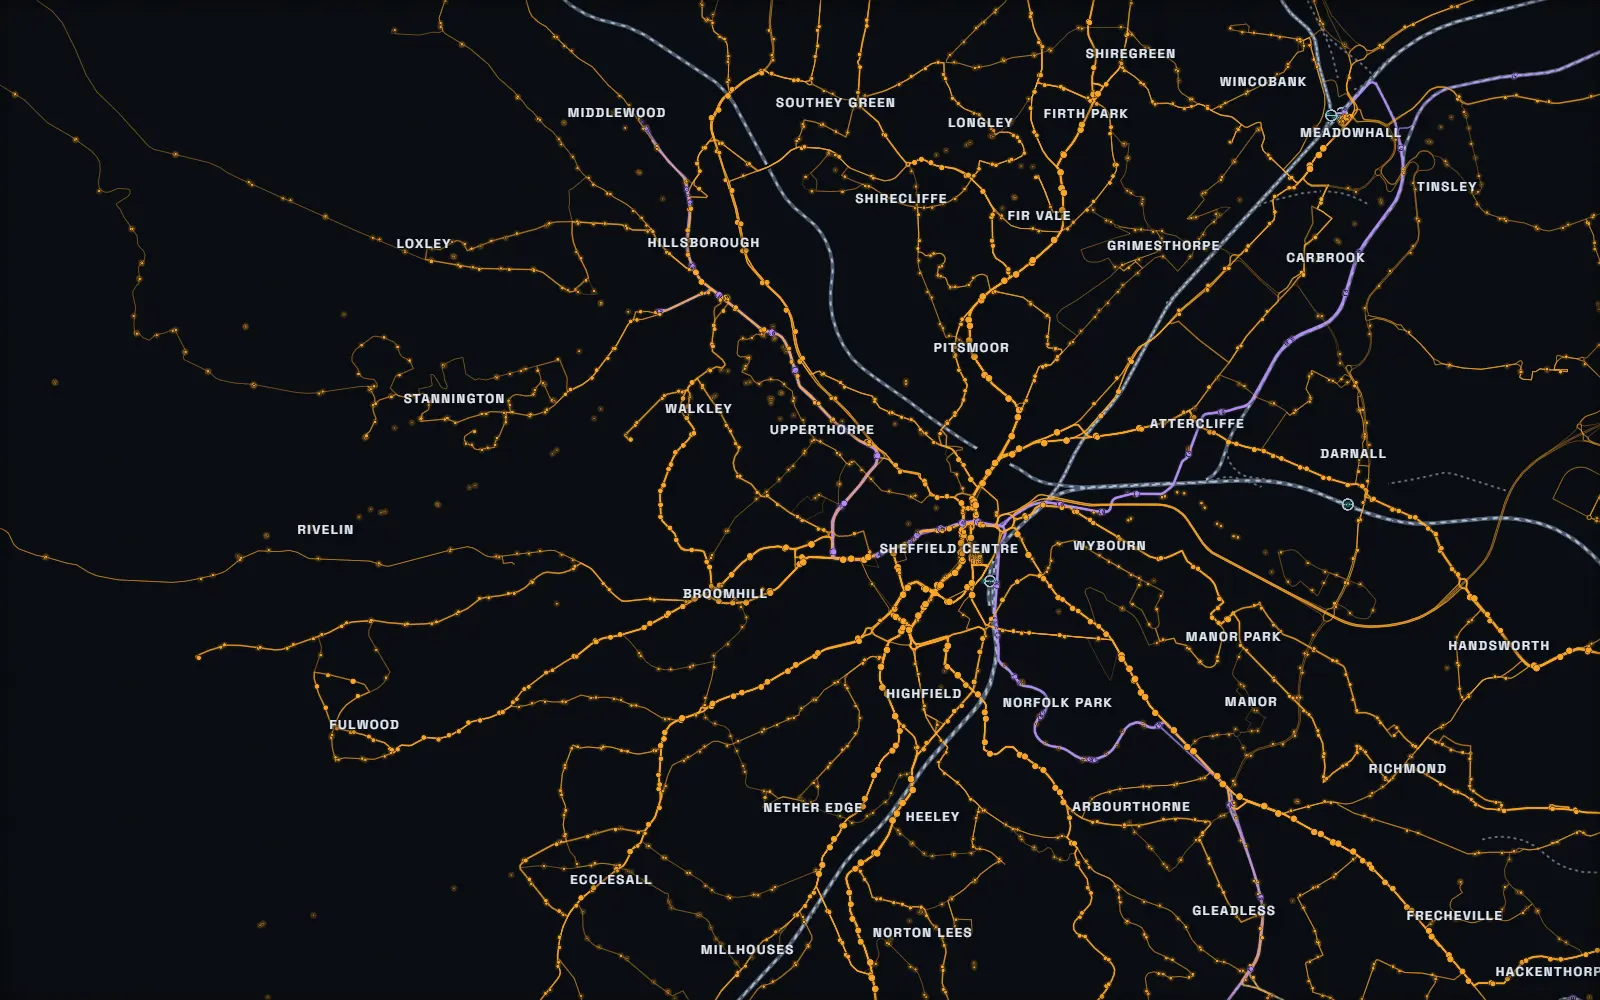
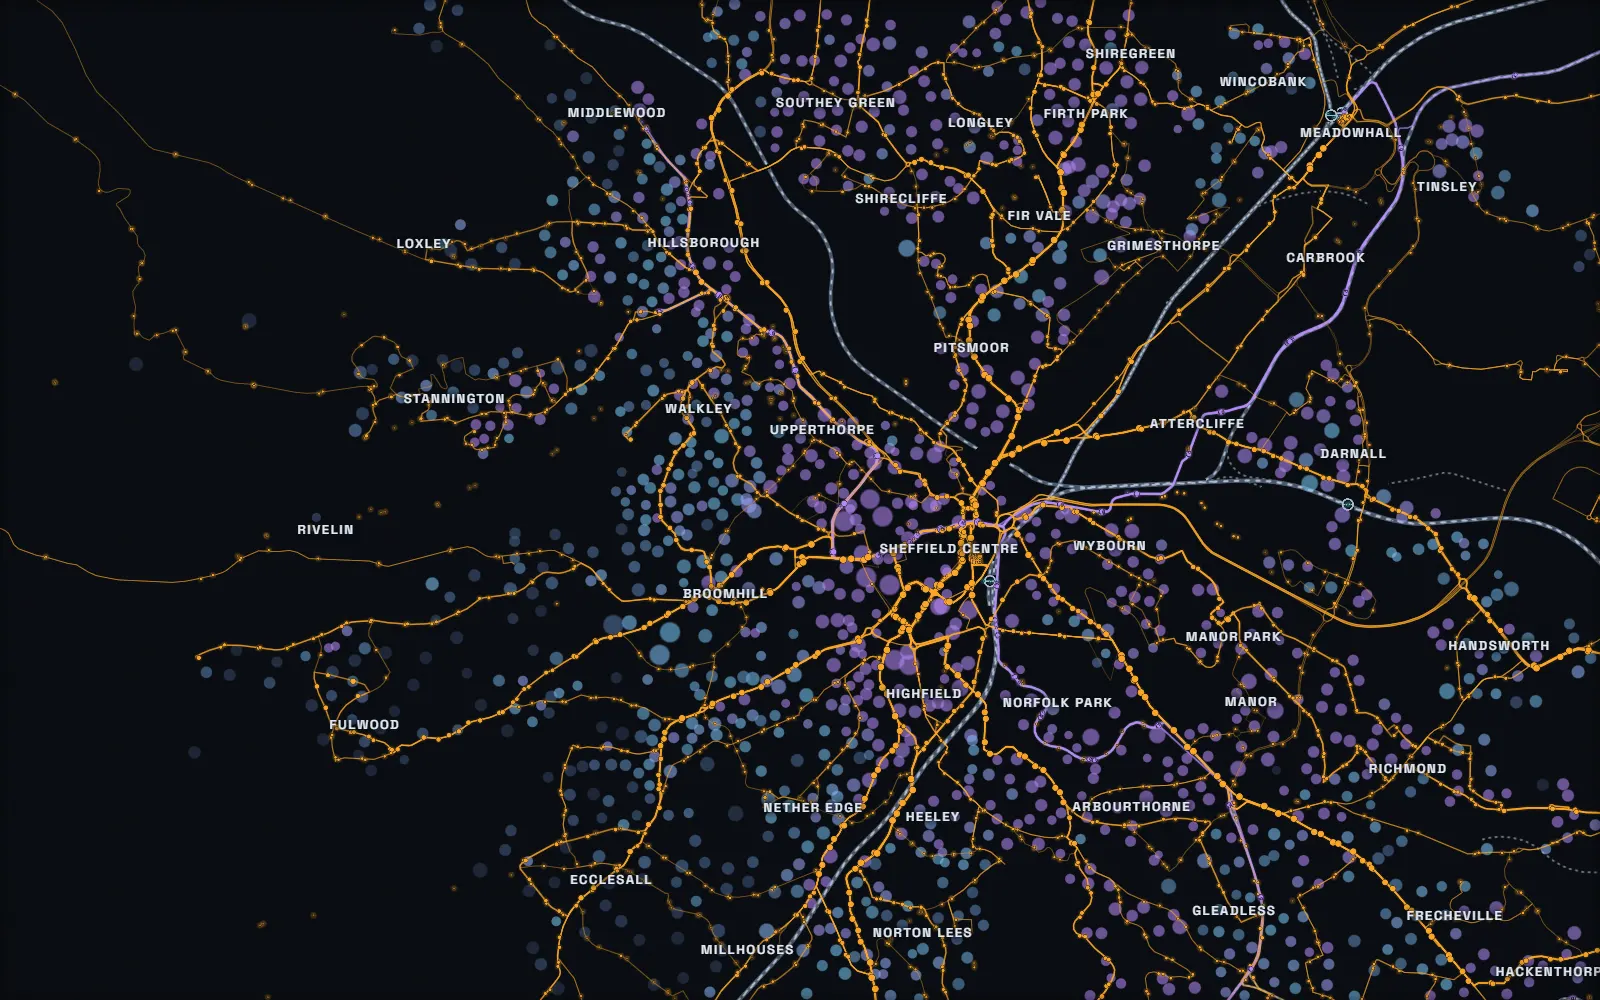
Sheffield's bus network on its own. The network With the need laid over it
Draw a route

Draw it, and see it costed while you draw.

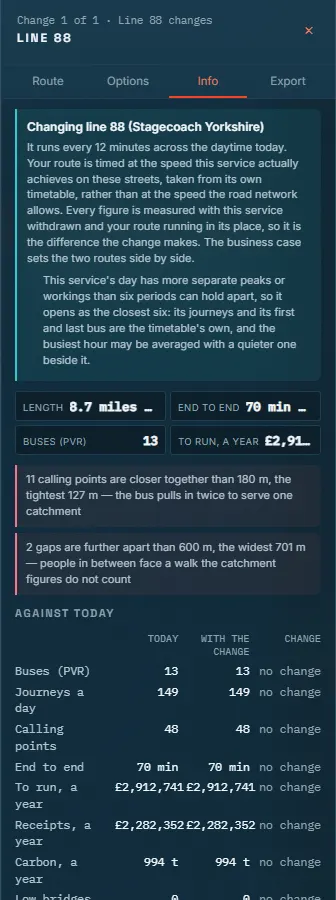
Click a route onto the map, or open one that runs today and change it. Each calling point goes on the kerb, the road is followed, and the figures move with every click: the people within a walk, the peak vehicle requirement, the journeys a day, the bill and the boardings.

  • Timed at the operator's own published pace, not the speed limit
  • Outbound and inbound drawn apart where the road demands it
  • Suggestions for stops and roads, priced before you take them
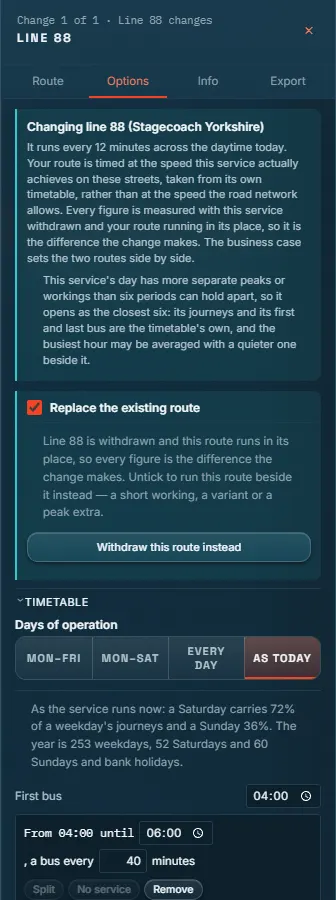
The Editor's Info tab on a change to route 88: its length, buses, running cost and the change against today. The Editor's Options tab: replacing the existing service, and the timetable by days of operation.

Projects

Many changes, measured as one network.

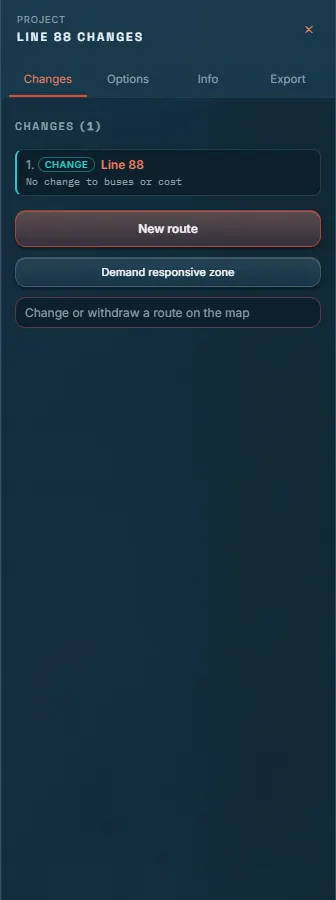
A project holds new routes, changed services and withdrawals together, under one set of assumptions. It is measured in one pass, so two routes that connect are worth more together and two that duplicate each other less, and it becomes a business case with a click.

  • Before and after for every change, side by side
  • Kept in your browser: nothing about a project stays on the server
  • Forecast and appraised on the Department's TAG terms
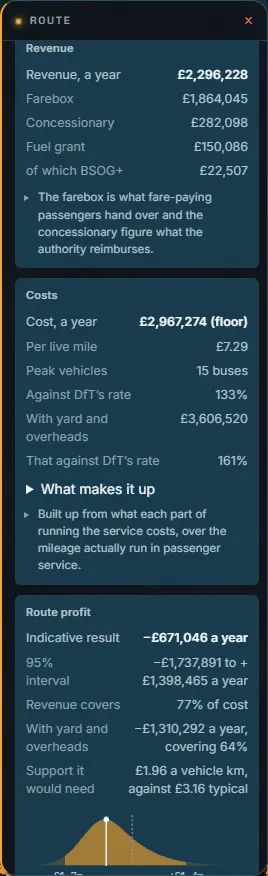
A PaxCast project holding a change to route 88, with the ways to add a new route, a demand responsive zone or a withdrawal. What the change's service earns and costs: revenue, the bill and the indicative result.

Opportunities

The corridors worth serving, found for you.

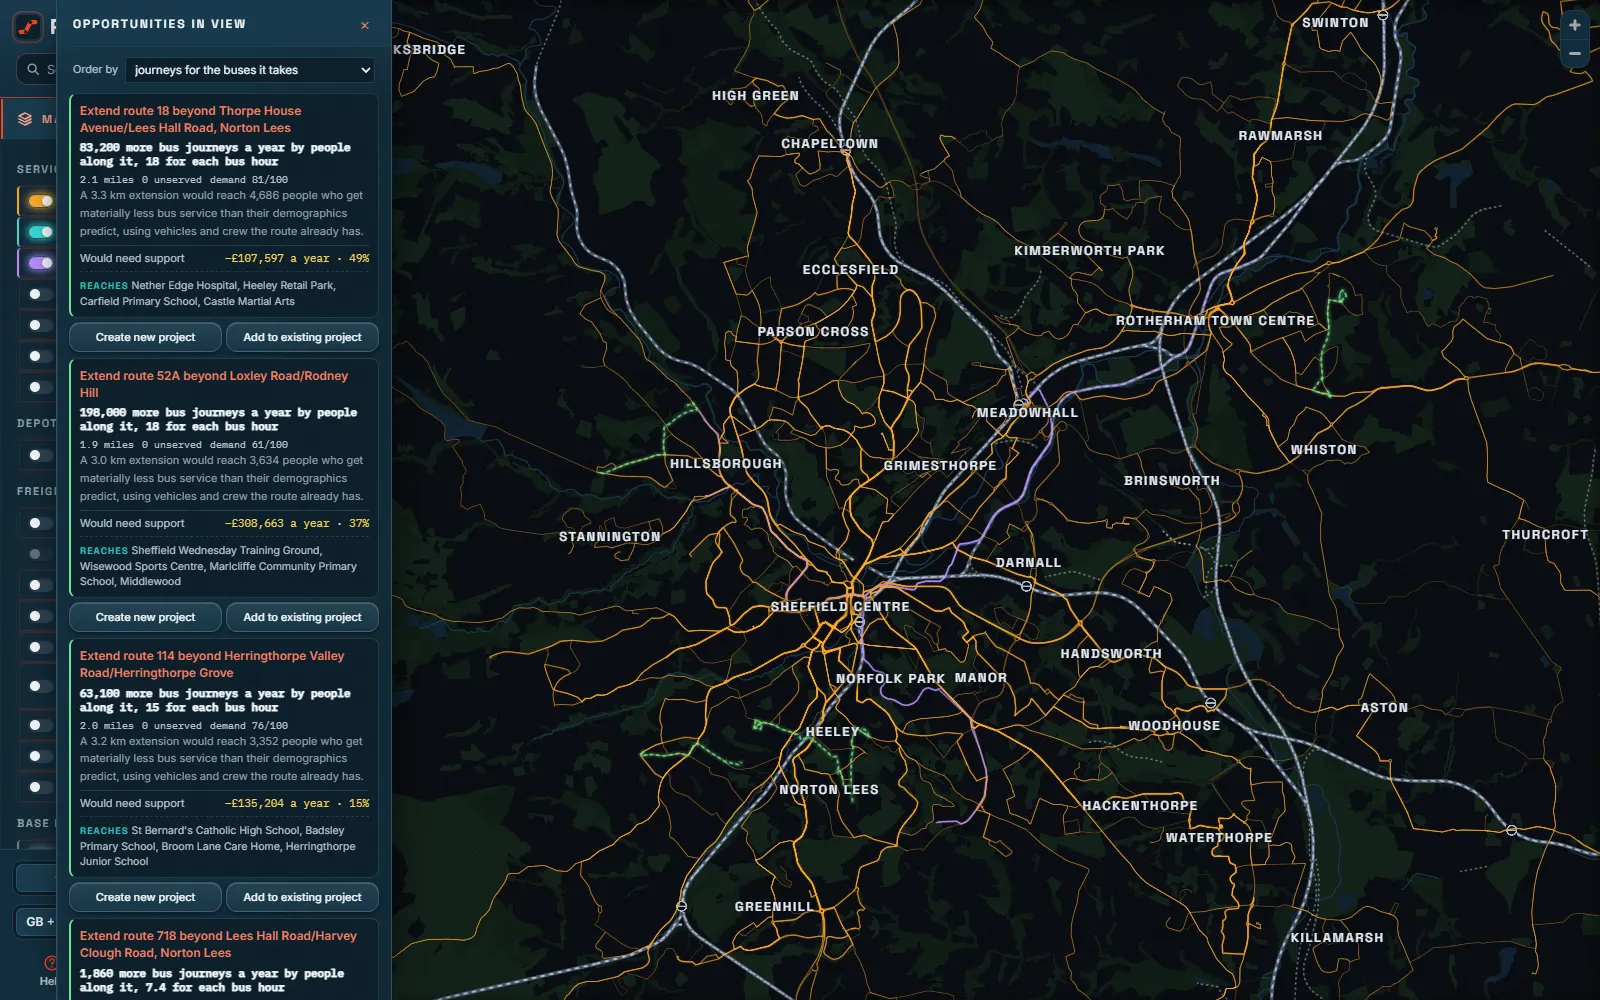
Every week PaxCast searches the whole network for routes stopping short of somewhere worth reaching, people no route goes near, services that run too rarely or finish too early, and two routes carrying one corridor. Each comes priced, and ordered by the bus journeys it would add for each bus hour it costs.

  • New links where people already commute and no single route joins them
  • Evenings and Sundays where a corridor goes dark
  • Open any one as a project and change it
The list of opportunities in view over Sheffield and Rotherham, each with the journeys it would add and the support it would need.

Reports

The document the committee asks for.

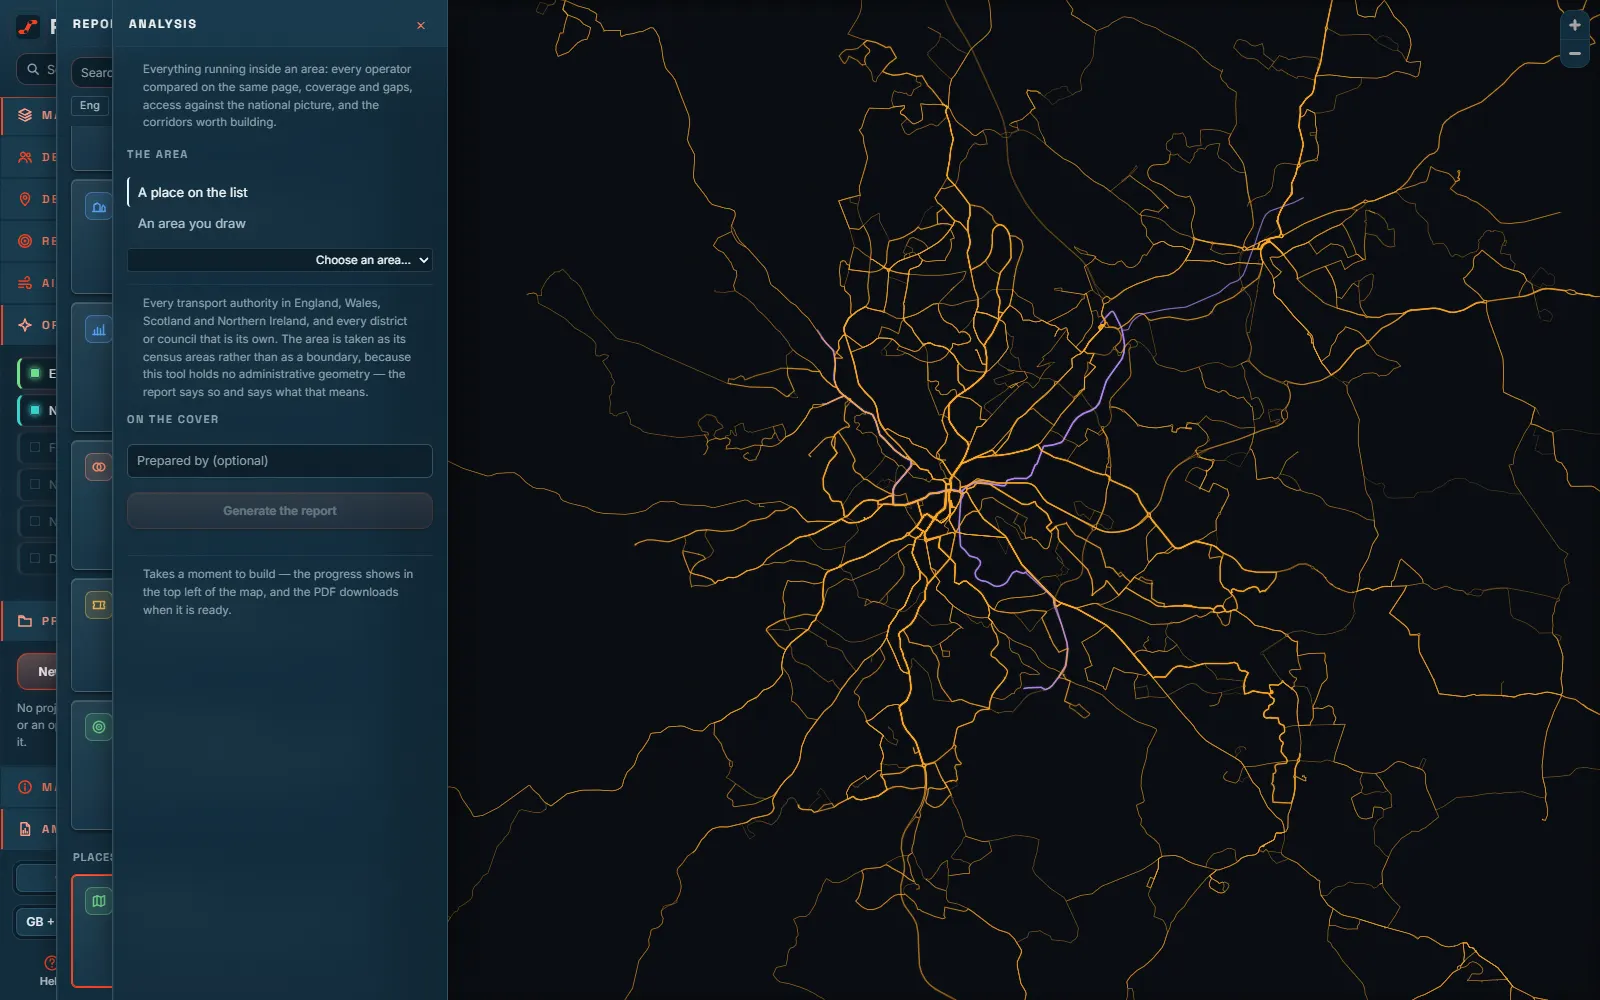
Thirty-three kinds of report, built on the server in a minute or two: an authority's network, a market's competition, a business case for a route, the socially necessary services under the Bus Services Act 2025, a constituency briefing, a depot study, a station's access. Each says where every figure came from, and what it cannot know.

  • PDF in the house style, or a PowerPoint deck
  • Every figure with its source and its date
  • Local transport plan, Plan B, disruption and DRT cases
The list of PaxCast reports beside the map, with the form for a region report open.

Everywhere it is asked

Four nations, and two places further away.

England, Wales, Scotland and Northern Ireland in one build, with the Republic of Ireland beside them, and New Zealand and New York State on the same terms. Each is read through England's models and its own published counts, money in its own currency, and refused in plain words where the data cannot answer.

  • On a phone, a tablet or a desk, in a dark map or a light one
  • Ask it from Claude, through a connector an administrator switches on
  • One server, on your own machine or ours
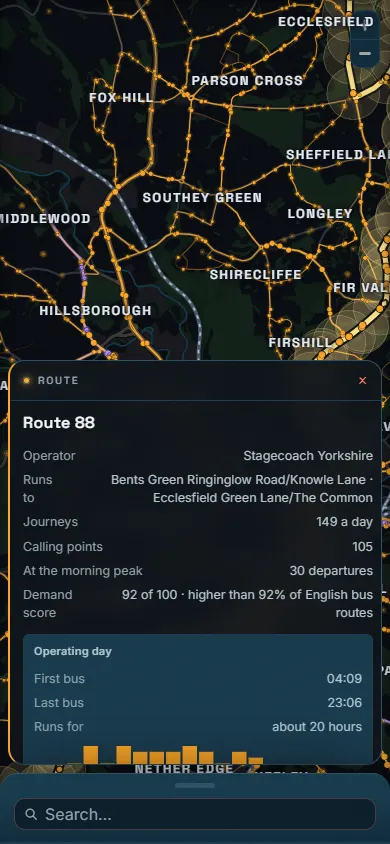
PaxCast on a phone, with route 88's card over the map.

02  Every route, opened

Click any service. Read it like its operator would.

First bus to last, hour by hour.

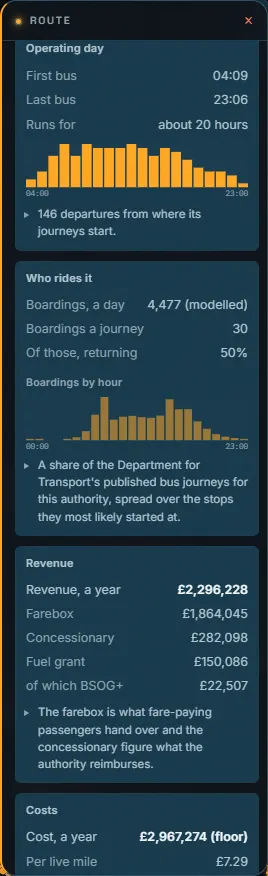
The operating day read off the timetable: when it starts, when it stops, how many journeys in each hour, and its headway at the morning peak. Weekday, Saturday and Sunday are each held from their own timetable.

Route 88's operating day: first bus, last bus and its journeys hour by hour.

03  Try the arithmetic

How many buses does a headway cost?

The first question about any service. Here is the sum PaxCast does, on a sample route that takes 40 minutes end to end and runs from six in the morning to eleven at night. Move the headway and watch the peak vehicle requirement step.

An illustration of the arithmetic, not a figure for any real service: round trip time with 12% recovery, divided by the headway, rounded up to whole buses.

every 15 min

6

buses at the peak (PVR)

136

journeys a day, both ways

90

minute round trip

The buses spaced around the round trip Town centre Estate

6 buses on the road at once. Every 14 minutes would need 7.

04  How it works

Open data in. A defensible answer out.

  1. 1

    Published data

    Every timetable in the Bus Open Data Service, NaPTAN's stops, the 2021 census, OpenStreetMap's roads and paths, and the Department's own bus statistics.

  2. 2

    One weekly build

    Routing graphs, a timetable network, demand, access and money models, checked against published figures before anything goes live.

  3. 3

    Asked on the map

    Click a stop, a route or a census area. Draw a route. Every answer arrives in a second or two, with the basis for each figure beside it.

  4. 4

    Taken to the room

    A business case, a briefing or a slide deck, in the language the industry uses: service, journey, headway and PVR.

Nothing about you is kept

Projects live in your browser and travel as files. The server keeps nothing you draw unless you ask it to.

It says what it cannot know

Absent is never nought. A figure that cannot be stated is refused in words, and every model is raced against a simple rival before it is trusted.

One binary, your server

The whole site and the whole data pipeline are one program. It runs on a laptop, or on the internet with its own certificate and Google sign-in.

05  Coverage

Measured on the same terms, wherever the data is open.

  • EnglandEvery transport authority, against the Department's own counts
  • WalesIts own journey count and its own bus money
  • ScotlandIts 2022 census and its own bus money
  • Northern IrelandTranslink's timetables, read as the authority's ledger
  • Republic of IrelandThe National Transport Authority's timetables, measured and never costed
  • New ZealandEach regional council's own feed, in New Zealand dollars
  • New York StateSixty agencies' timetables, in US dollars

See it on your network.

We will open PaxCast on your authority or your operating area and walk you through what it finds. No preparation needed: the data is already in.